Pathologies: Difference between revisions
Jump to navigation
Jump to search
Created page with "How can we judge the quality of a data set? There are several possibilities: # numerical indicators, like R-values, I/sigma and the like # graphical representations This arti..." |
(No difference)
|
Revision as of 12:29, 27 November 2013
How can we judge the quality of a data set? There are several possibilities:
- numerical indicators, like R-values, I/sigma and the like
- graphical representations
This article serves to demonstrate pathological cases. It collects examples for
- problems with the hardware (e.g. detector, beamline, goniostat, beam, cryo)
- problems with the crystal
- problems with data processing
Hardware problems
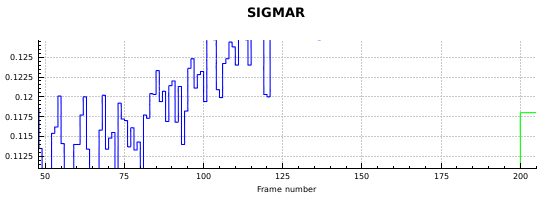
Scale factor plot in case of spindle problems
This shows spikes indicating that the spindle went too fast every 12 frames or so. This is quite detrimental to data quality.


