Jiffies
Here is a one-liner for your .cshrc :
alias scalefactors "egrep ' ..... 0 ...... ........ .. ..... .... ... ...... ......' INTEGRATE.LP"
In sh/bash/ksh/zsh syntax this would be:
alias scalefactors='egrep " ..... 0 ...... ........ .. ..... .... ... ...... ......" INTEGRATE.LP'
which could go into ~/.bashrc (or should it go into .login or .profile?)
scalefactors finds those lines in INTEGRATE.LP which match a certain pattern of blanks and non-blanks. These are just the lines printed during the INTEGRATE step for each frame. It is very useful (e.g. to find shutter problems, or to "see" the crystal die from radiation damage) to run
scalefactors > frames.scales
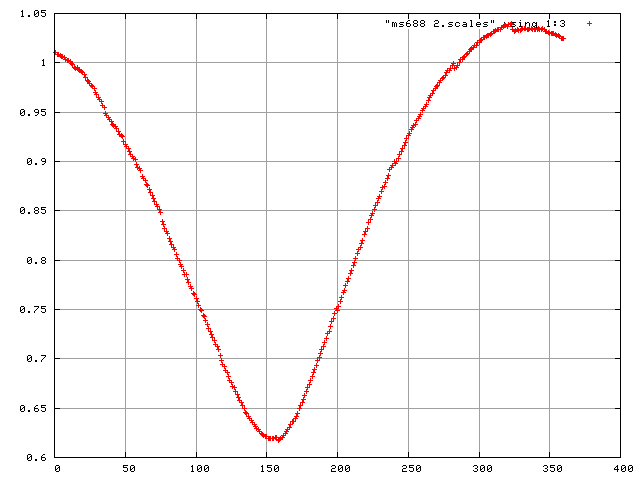
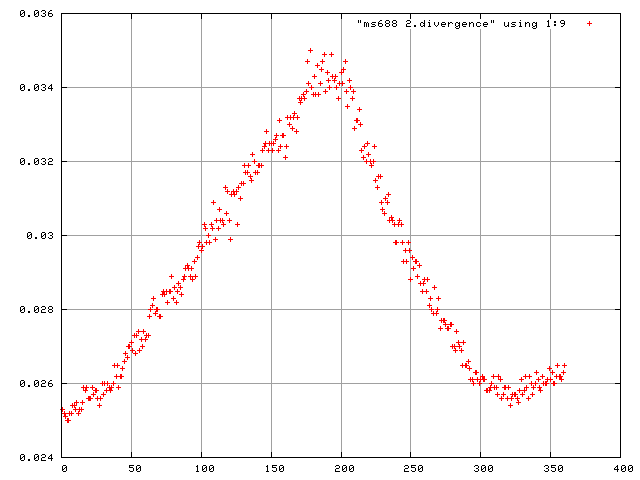
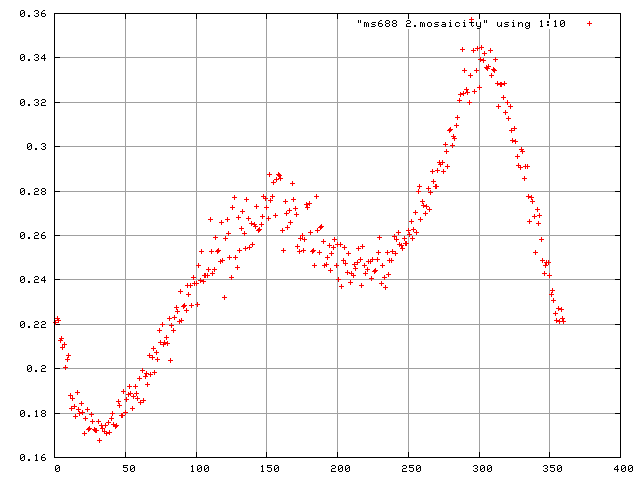
and to plot the scale factors and mosaicity and beam divergence of each frame in gnuplot.
This can be done by
> gnuplot
plot "frames.scales" using 1:3
or
> gnuplot
plot "frames.scales" using 1:9
or
> gnuplot
plot "frames.scales" using 1:10
It is useful to run gnuplot this way, because you can move the mouse over an outlier and see its coordinates (x=frame number) in the lower left corner of the plot window.
If you do have bad outliers (e.g. shutter didn't open), and decide that you for now simply want to remove those frames, then you could rename the frames (just append ".bad" to the name), and re-run XDS from the INTEGRATE step.
If you simply want the plots and glue them into your lab book, just run (assuming "ms688_2" is the name of your dataset!):
#!/bin/csh -f
setenv DATASET ms688_2

scalefactors > $DATASET.scales
ln -s $DATASET.scales $DATASET.mosaicity
ln -s $DATASET.scales $DATASET.divergence

gnuplot<<EOF
set term png
set grid
set out 'scale.png'
plot "$DATASET.scales" using 1:3
set out 'divergence.png'
plot "$DATASET.divergence" using 1:9
set out 'mosaicity.png'
plot "$DATASET.mosaicity" using 1:10
EOF

rm -f $DATASET.{scales,mosaicity,divergence}


