Xds maxcc12
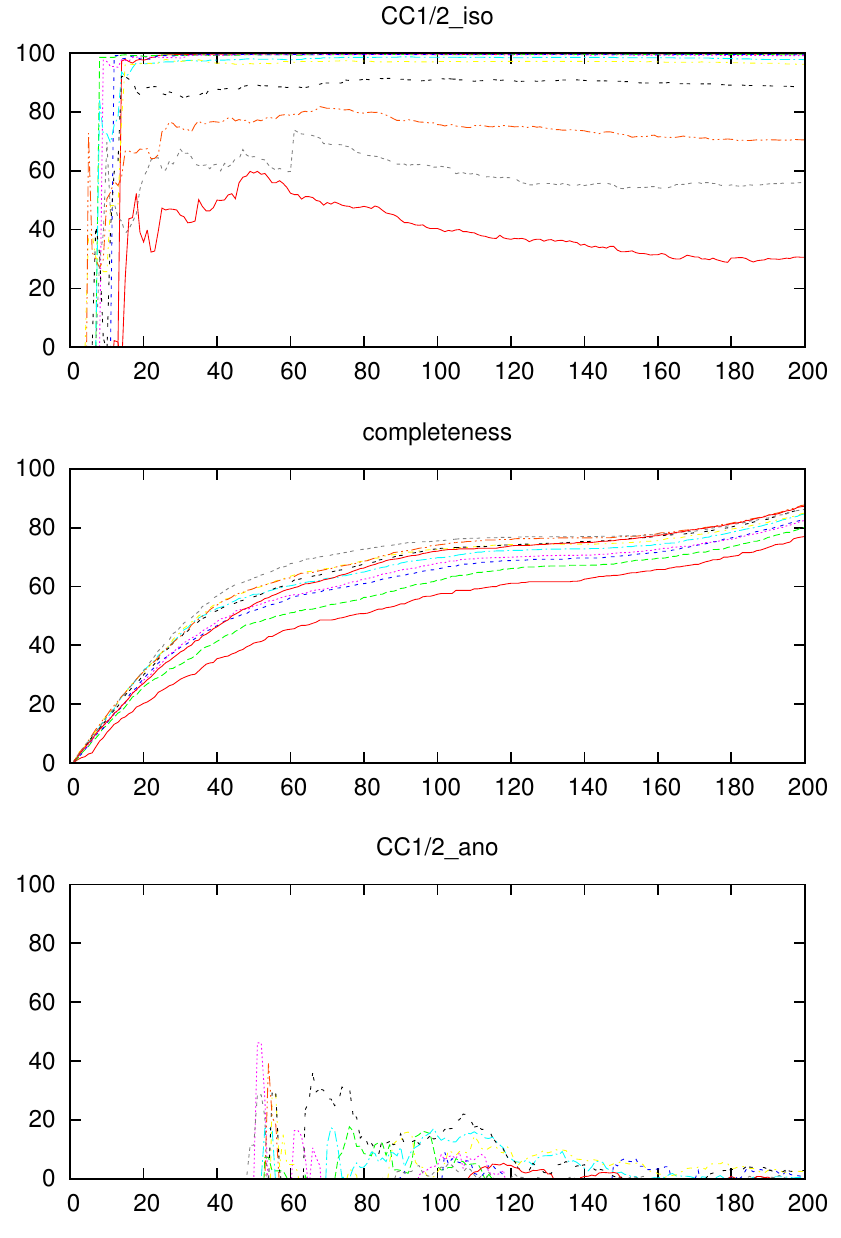
To analyze XDS_ASCII.HKL in terms of the detailed course of CC1/2 by frame number and resolution, you could use the program XDS_MAXCC12 .
You also need a script such as
#!/bin/bash
xds_maxcc12 XDS_ASCII.HKL > xds_maxcc12.log
# xds_maxcc12 has options for resolution range and number of bins
grep a$ xds_maxcc12.log > temp.a
grep c$ xds_maxcc12.log > temp.c
grep d$ xds_maxcc12.log > temp.d
paste temp.a temp.c temp.d | sed -e 's/a. //' -e 's/c. //' > temp.dat
gnuplot<<eof
set term postscript color portrait
set out 'xds_maxcc12.ps'
set yrange [0:100]
set multiplot layout 3,1
set title "CC1/2_iso"
# adding labels to the lines make the plot ugly so remove them;
# but if you want to know which line is which resolution range then
# comment out the next line:
set nokey
plot 'temp.dat' us 1:2 w li,'temp.dat' us 1:3 w li,'temp.dat' us 1:4 w li,\
'temp.dat' us 1:5 w li,'temp.dat' us 1:6 w li,'temp.dat' us 1:7 w li,\
'temp.dat' us 1:8 w li,'temp.dat' us 1:9 w li,'temp.dat' us 1:10 w li,'temp.dat' us 1:11 w li

set title "completeness"
plot 'temp.dat' us 1:12 w li,'temp.dat' us 1:13 w li,'temp.dat' us 1:14 w li,\
'temp.dat' us 1:15 w li,'temp.dat' us 1:16 w li,'temp.dat' us 1:17 w li,\
'temp.dat' us 1:18 w li,'temp.dat' us 1:19 w li,'temp.dat' us 1:20 w li,'temp.dat' us 1:21 w li

set title "CC1/2_ano"
plot 'temp.dat' us 1:22 w li,'temp.dat' us 1:23 w li,'temp.dat' us 1:24 w li,\
'temp.dat' us 1:25 w li,'temp.dat' us 1:26 w li,'temp.dat' us 1:27 w li,\
'temp.dat' us 1:28 w li,'temp.dat' us 1:29 w li,'temp.dat' us 1:30 w li,'temp.dat' us 1:31 w li
unset multiplot
quit
eof
rm temp.a temp.c temp.d temp.dat
# next line: replace okular with your favourite postscript viewer
okular xds_maxcc12.ps
# convert to pdf; this compresses and makes it easier to print it
ps2pdf xds_maxcc12.ps xds_maxcc12.pdf
# you could now use a PDF viewer
rm xds_maxcc12.ps
which you save as plot_maxcc12.rc in your ~/bin or (as root) in /usr/local/bin . Now, after processing a dataset with XDS, you can simply use plot_maxcc12.rc and get plots like
