XDSi screenshots
XDSi screenshots
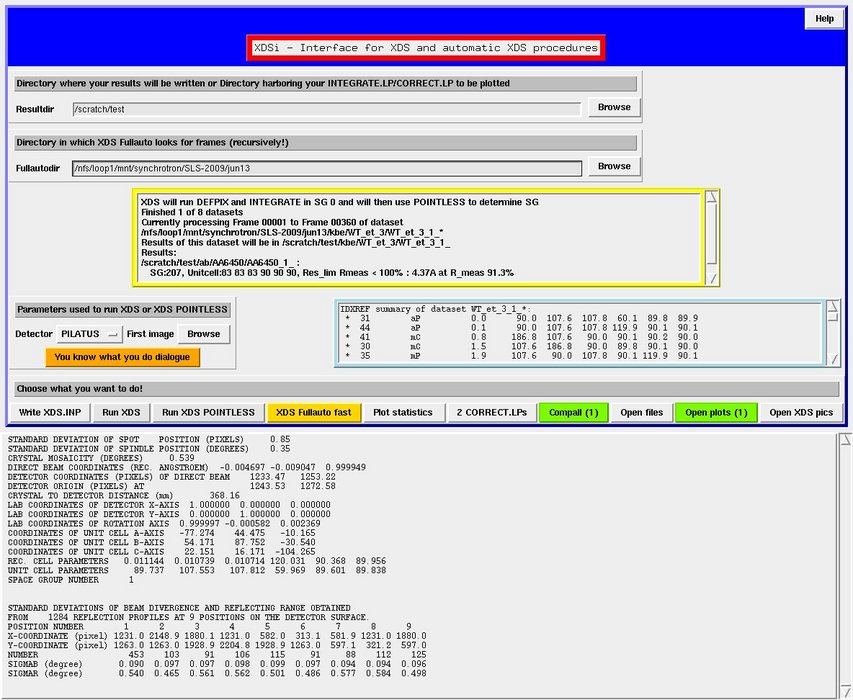
- This screenshot shows XDSi during an XDS Fullauto run. The yellow infobox displays information about the dataset that is currently being processed and about the datasets that have already finished processing. The blue infobox displays a summary of IDXREF.LP for the dataset that is currently being processed.
- This screenshot shows the infobox during an XDS Fullauto run.
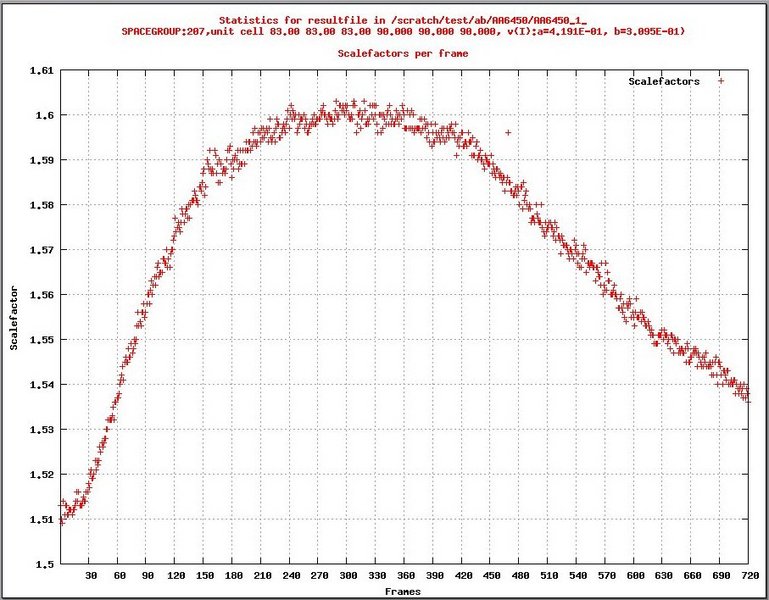
- This screenshot shows the first plot of the file plots.pdf that is generated for each dataset. It shows the scalefactors per frame and gives information about the dataset. The a- and b- values of the function [math]\displaystyle{ v(I)=a(v_0 (I) + b I^2) }[/math] are also given.
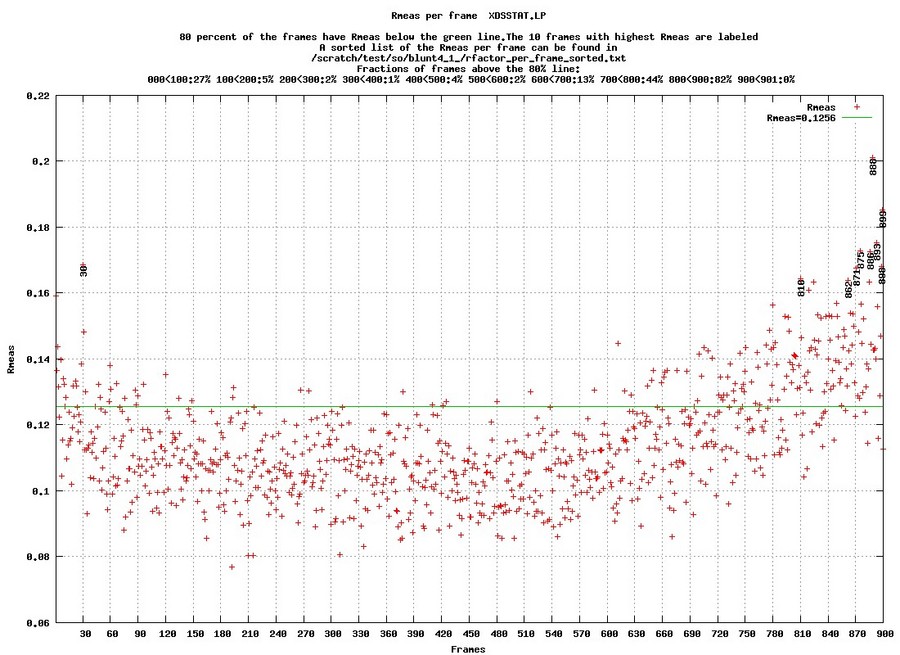
- This screenshot is also taken from the file plots.pdf and shows the Rmeas values per frame (taken from XDSSTAT.LP).
- A green line indicates the threshold below which are 80% of all frames.
- The fraction of frames excessing the threshold for each intervall of 100 frames is given and the 10 frames with highest [math]\displaystyle{ R_{meas} }[/math] are labeled.
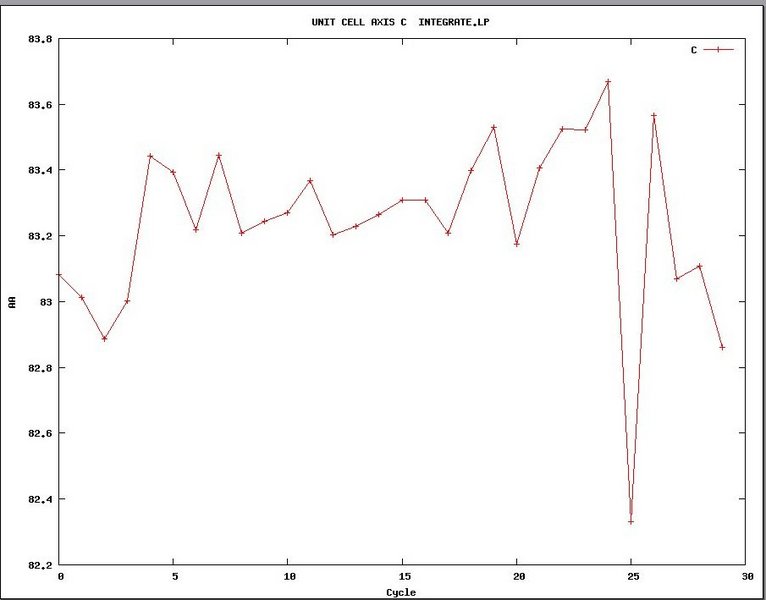
- This screenshot shows the lengthrefinement of the "c" axis during each integration cycle
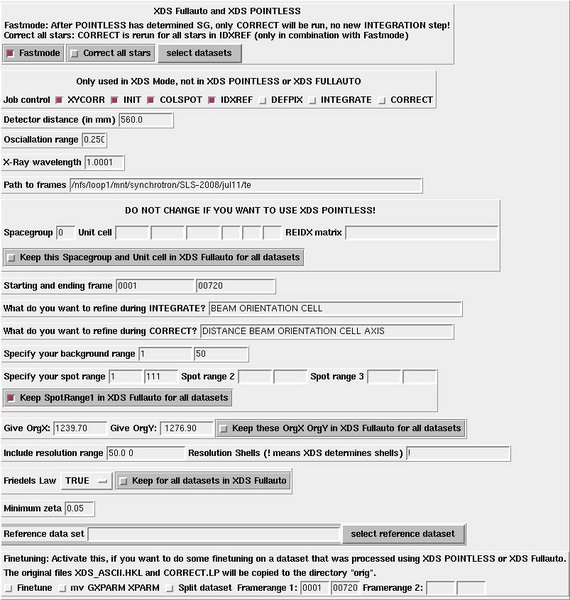
- This screenshot shows the "You know what you do dialogue"
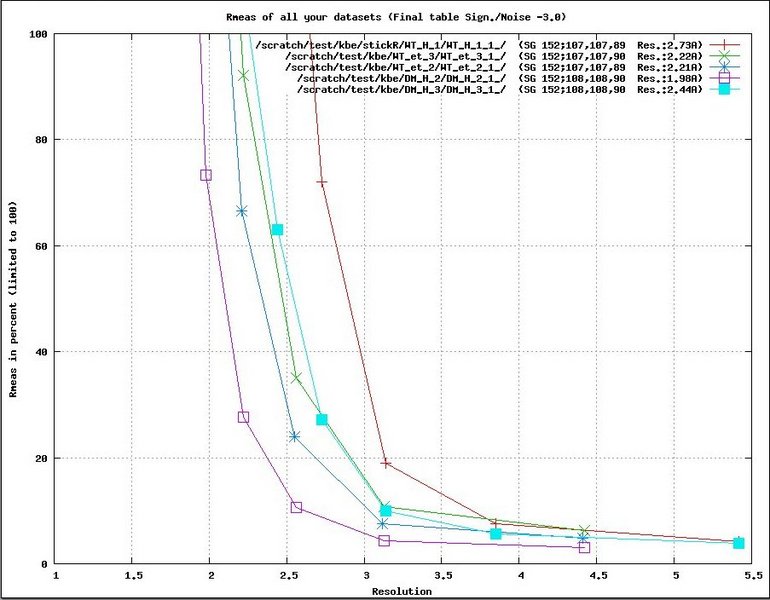
- This screenshot shows the first plot of the file compall.pdf that is generated after XDS Fullauto has finished. It compares the Rmeas of all the datasets that have been processed.
